Construction
Infrastructure Contractor Website
A direct, project-led website presenting capabilities, company experience and specialist infrastructure services.
Explore conversion-led websites across the industries we serve, followed by verified search performance from live campaigns.
Conversion-led website experiences across local services, healthcare, hospitality, professional services and industrial sectors.
A direct, project-led website presenting capabilities, company experience and specialist infrastructure services.
A vibrant venue experience balancing games, events, food and booking calls to action.
A conversion-focused local services site built around urgent enquiries, service discovery and trust.
An approachable healthcare journey combining education, guided choices and clear next steps.
A confident corporate presentation connecting services, sectors, company story and industry insight.
A clear local plumbing website with service detail, customer reassurance and prominent contact paths.
A focused advisory website using strong positioning, structured offers and a guided consultation journey.
A product-led supplier website combining equipment discovery, financing, team expertise and industry news.
Every chart below is an unedited Google Search Console export from live client campaigns. Figures are period totals shown by Search Console for the dates in each screenshot.
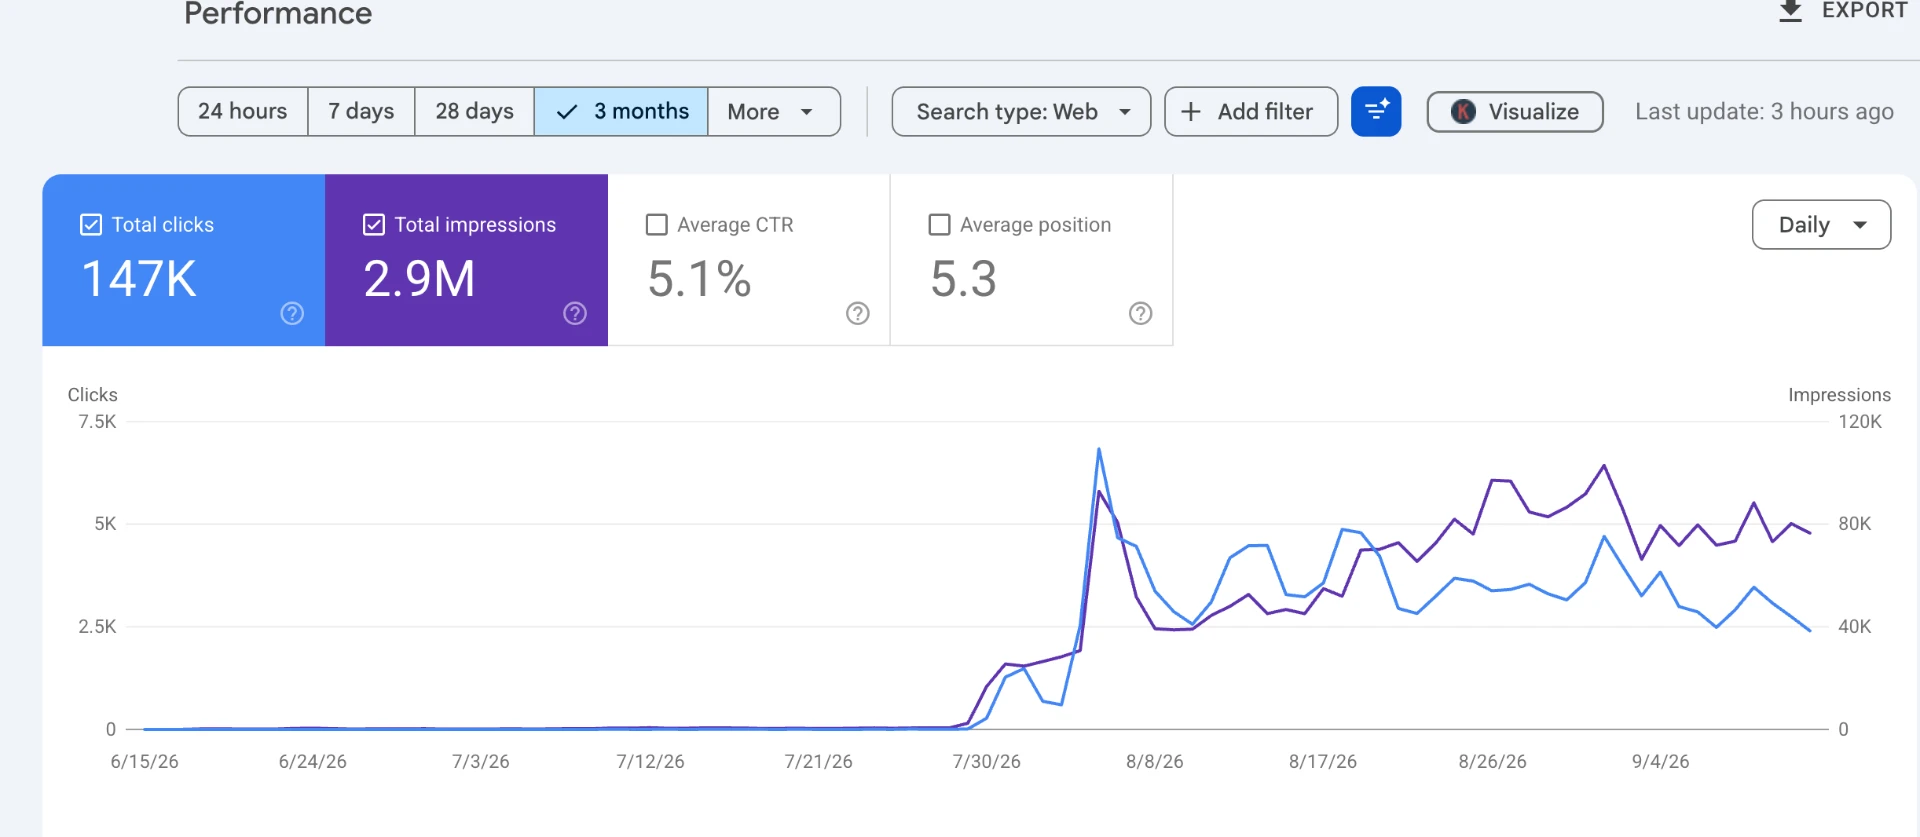
Google Search Console performance for a client programme that scaled from a near-flat baseline to sustained daily click volume.
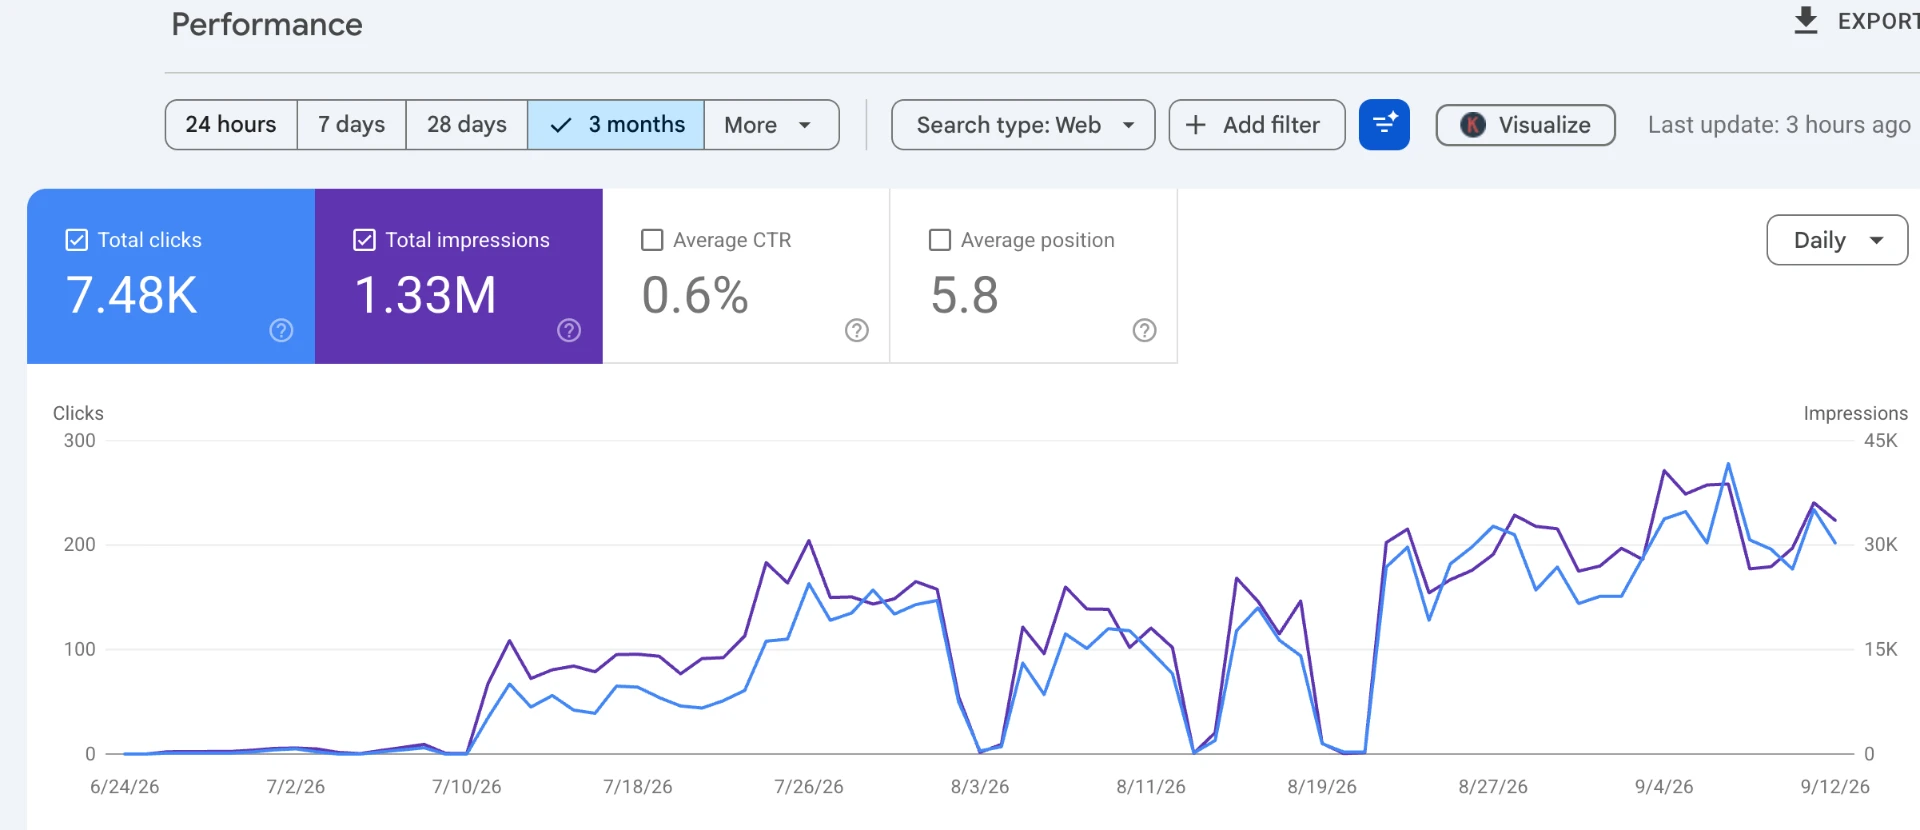
Impressions and clicks climbing together after technical clean-up and topical content build-out.
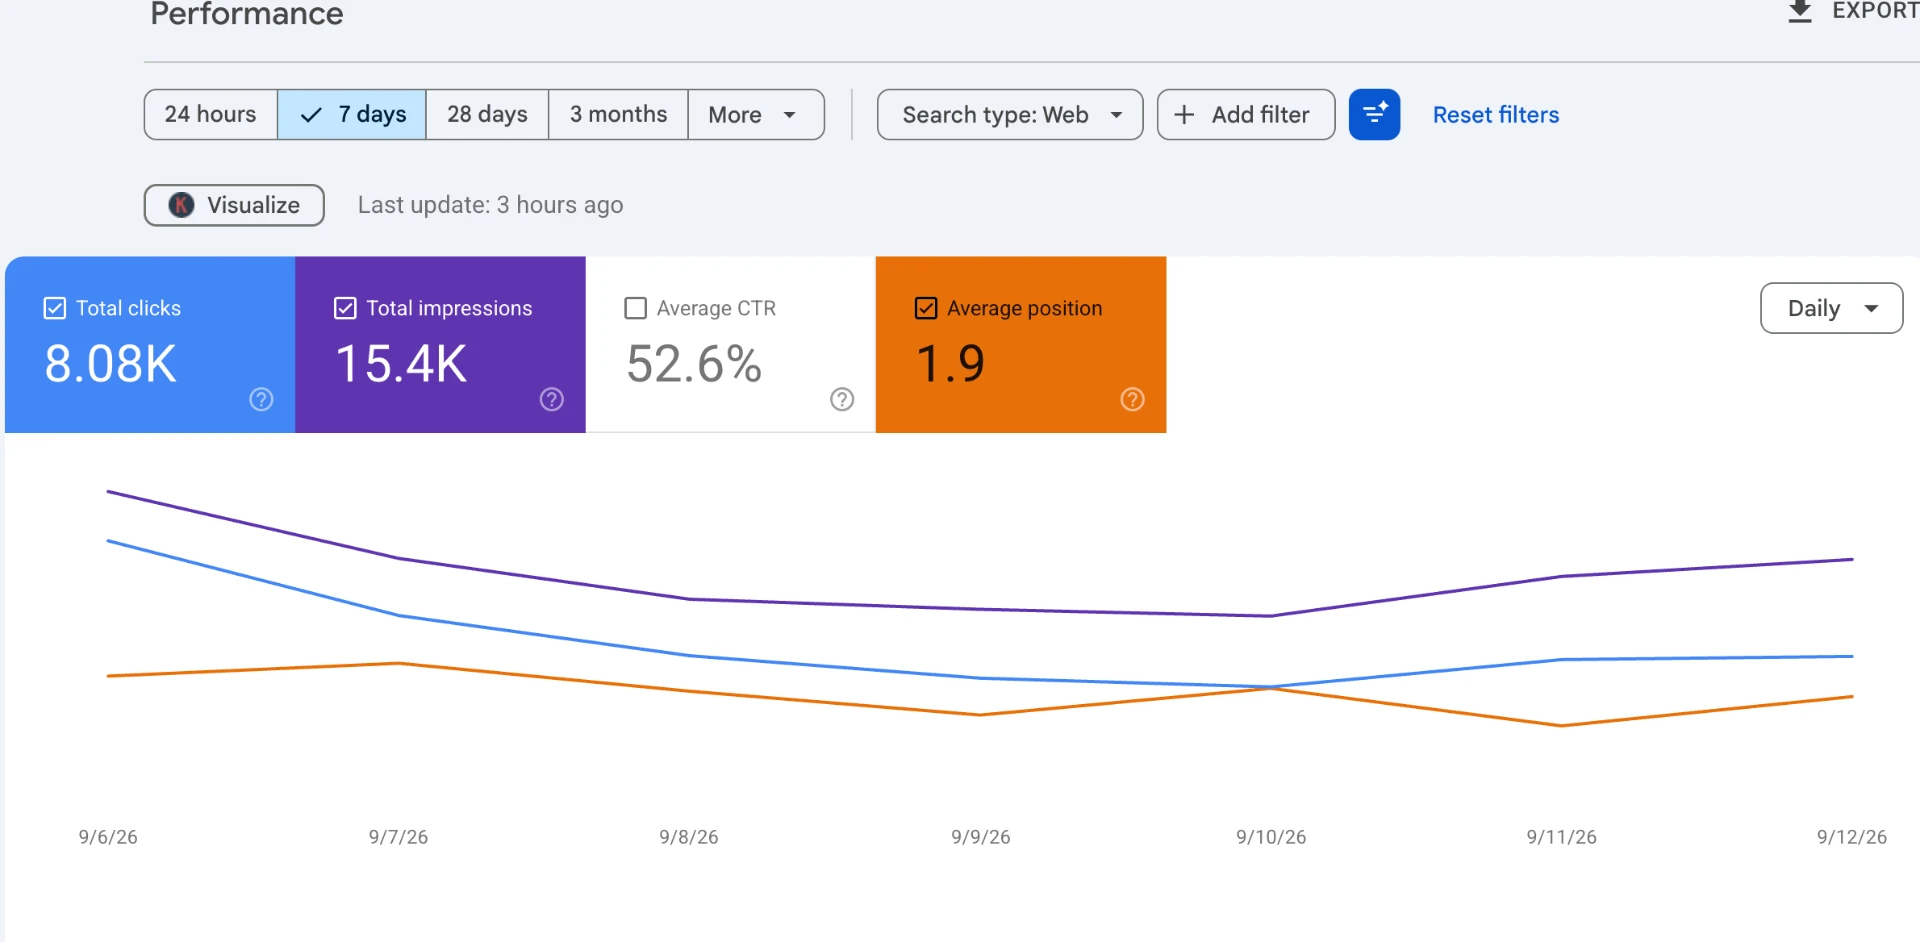
A high-intent query set holding position 1.9, where titles and descriptions are earning most of the available clicks.
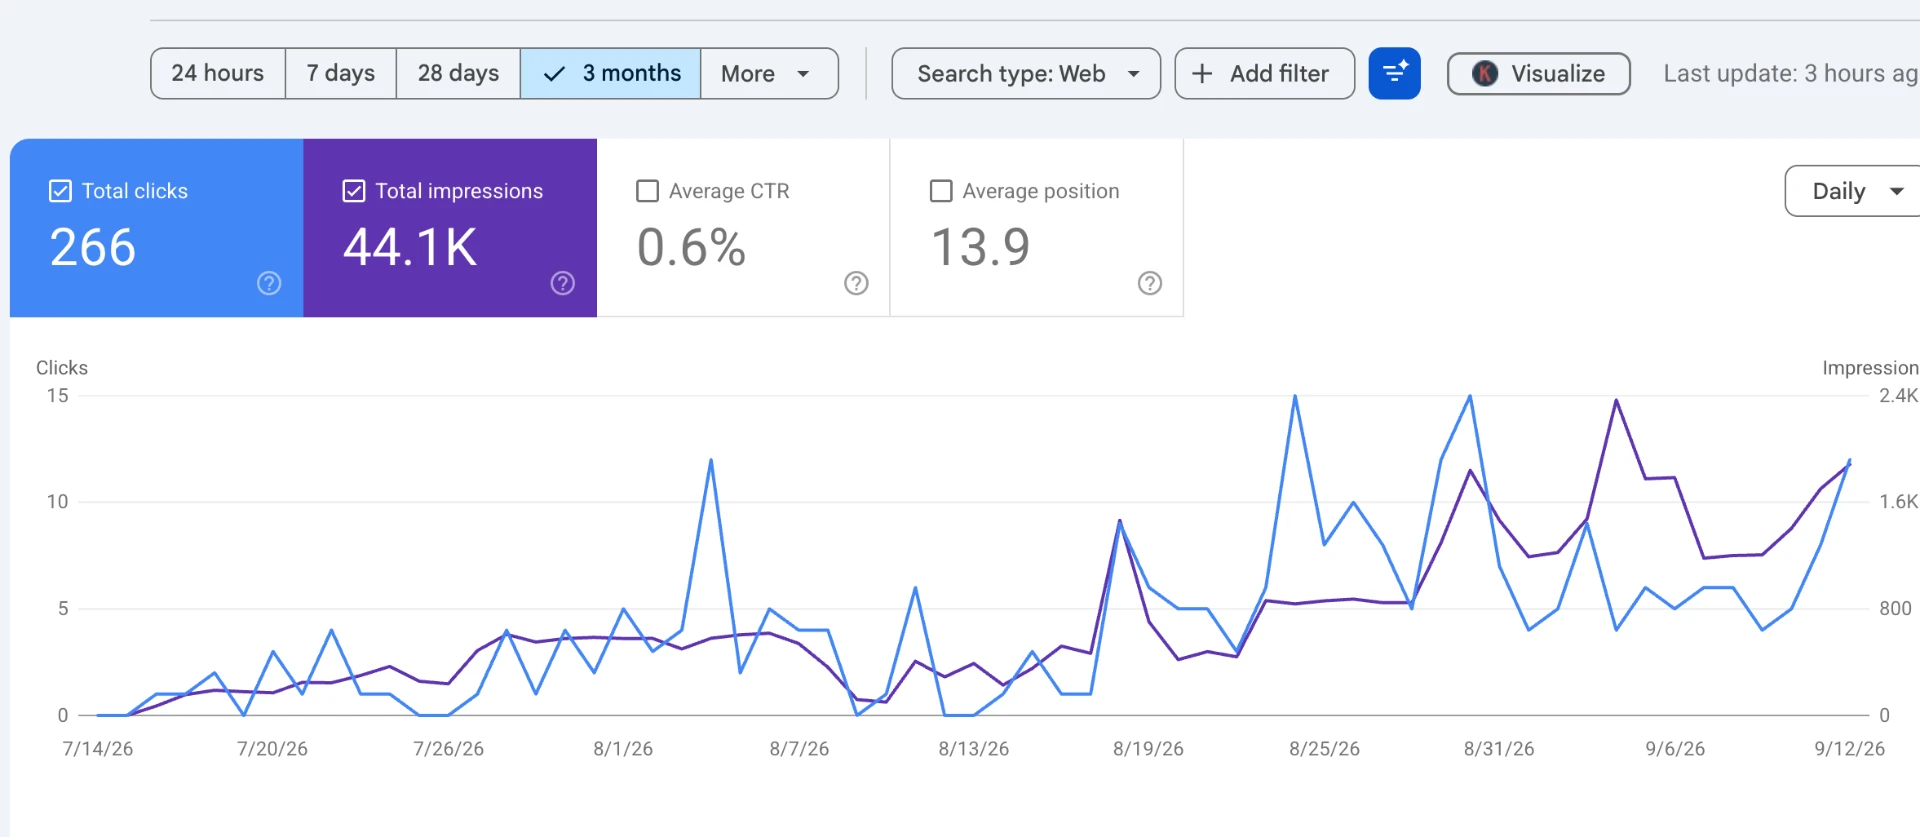
An early-stage site building its first consistent impression and click curve across the quarter.
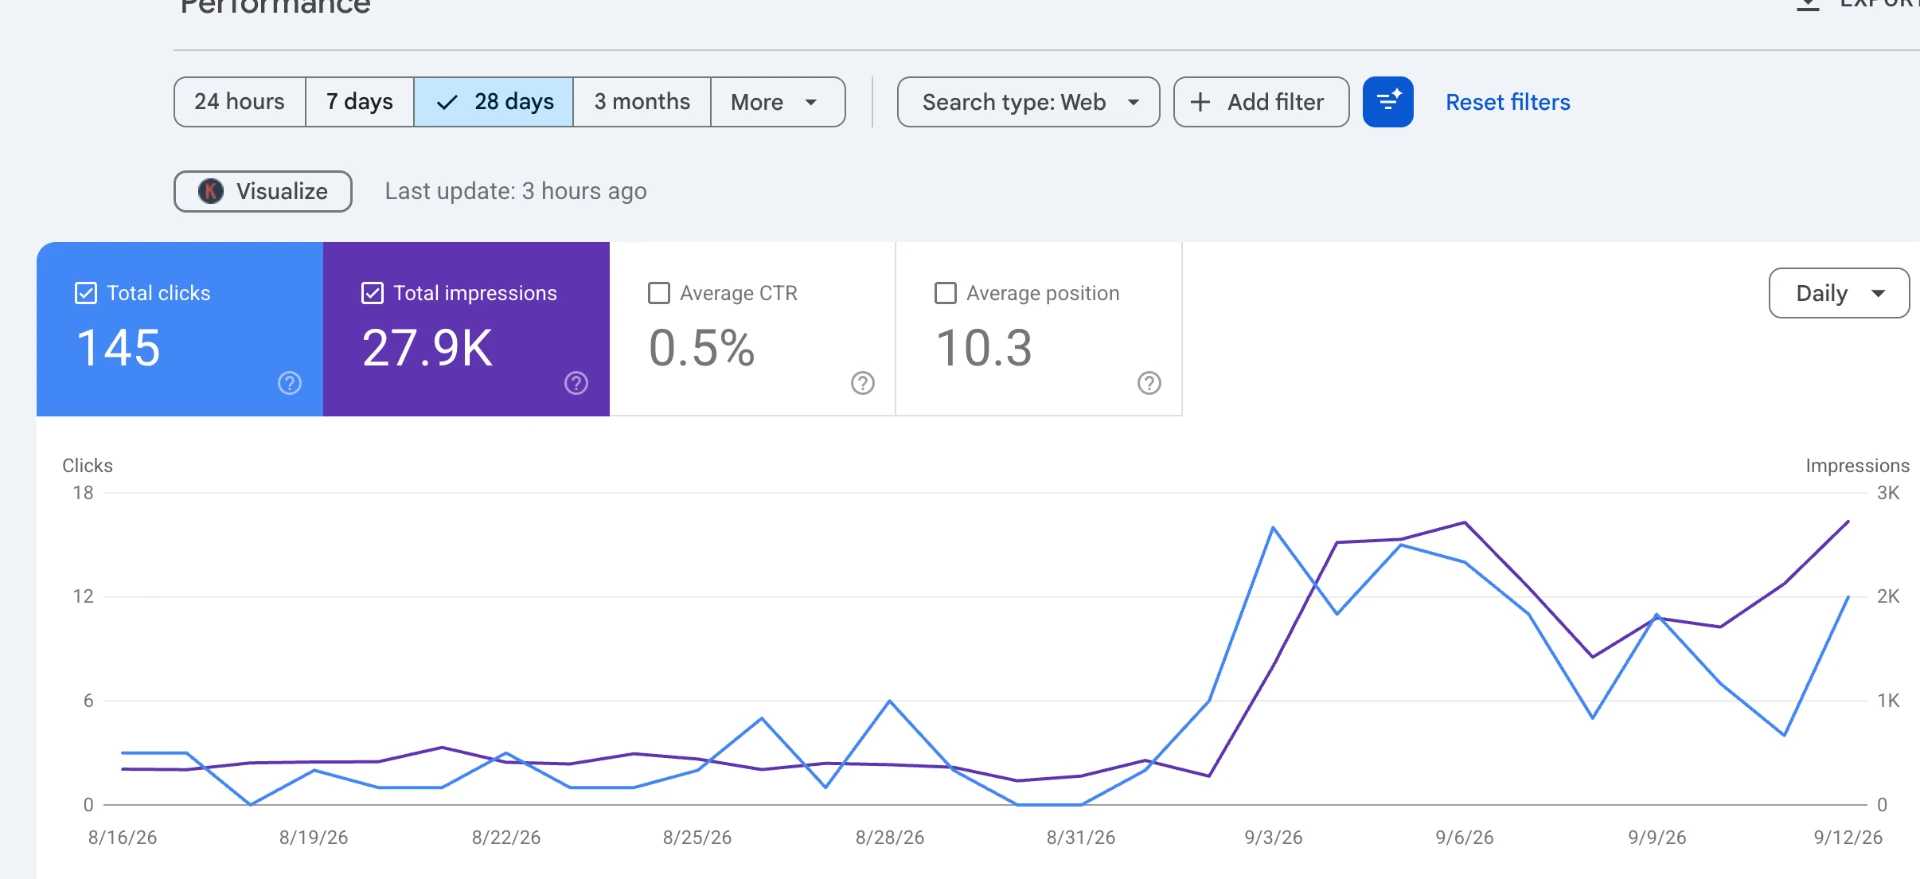
The month where a new content cluster started ranking and daily impressions moved into the thousands.
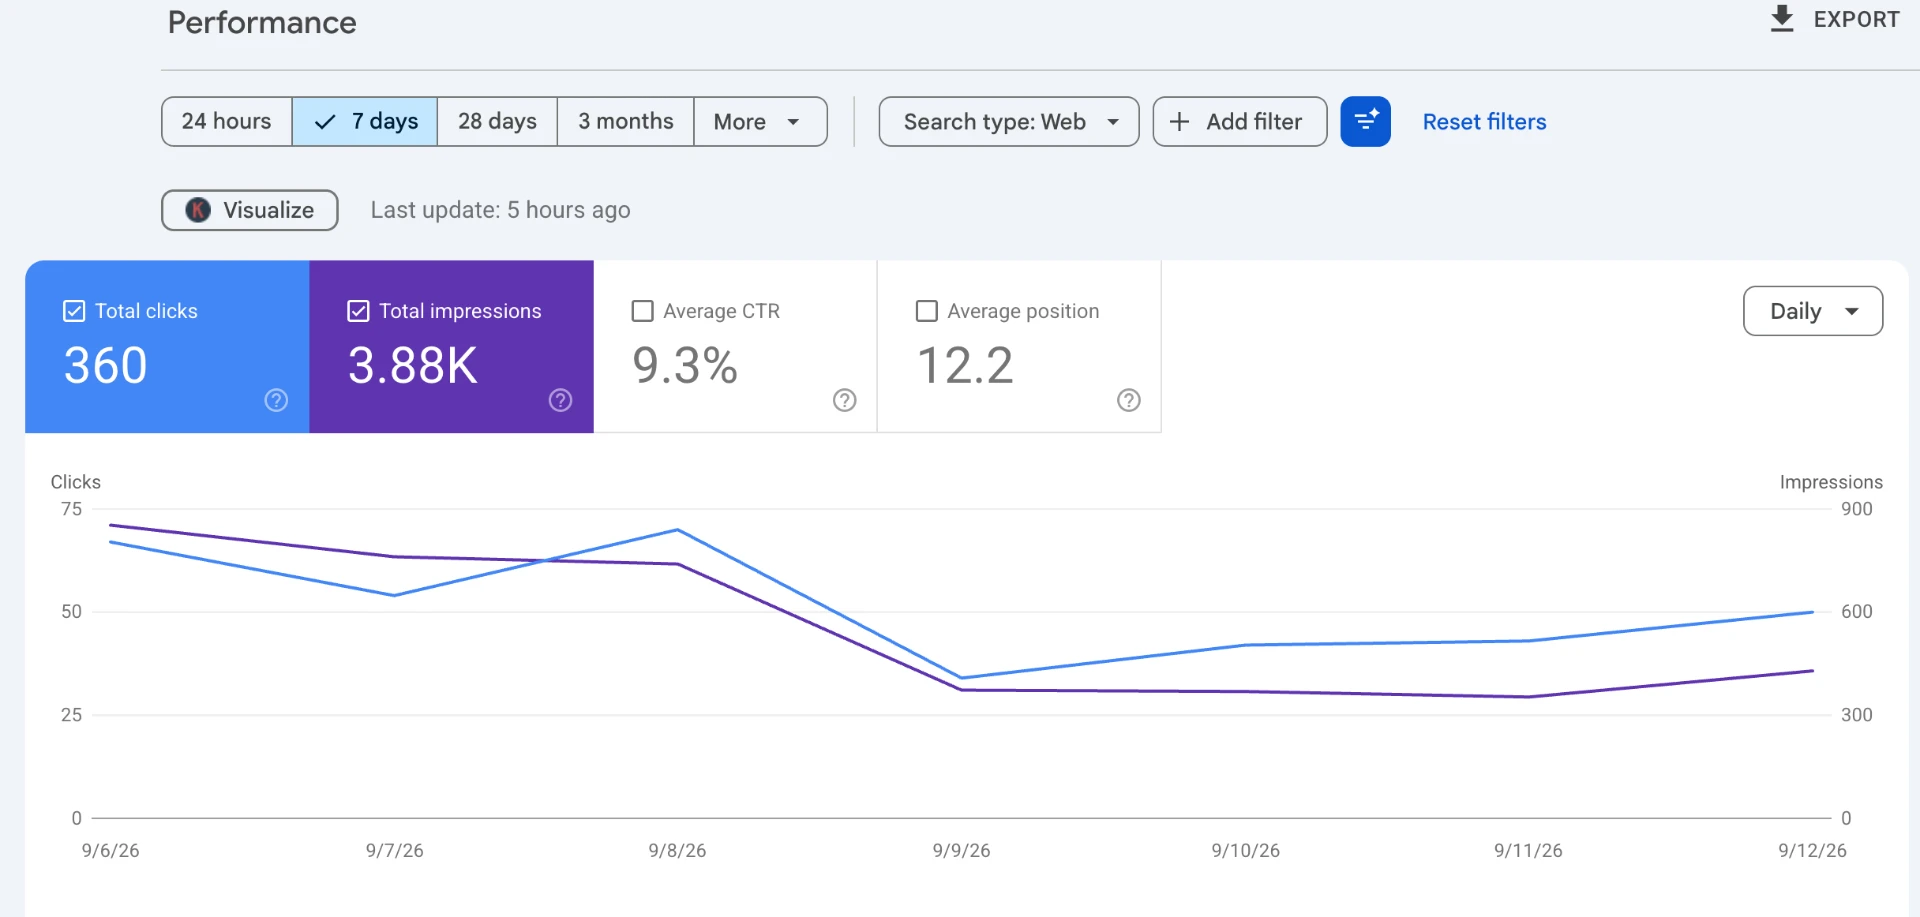
A steady weekly snapshot showing clicks tracking impressions closely on commercial terms.